
Bitcoin Market Analysis (2020–2017) — How the BTC Market has changed | A Look at 4 Years of Market…
Blockonomics recently conducted an analysis of our merchant data to explore how the market has evolved in the past years.

Bitcoin Market Analysis [2017–2020] — A Look at 4 Years of Market Change
Bitcoin evolution in the past 10 years has been nothing short of a roller coaster ride. A currency that was not even heard of a decade ago has now reached a market cap of $202 billion with an estimated transaction volume of $1.5 billion each day.
Bitcoin's monumental rise is not just seen in its price but also in its adoption. It is estimated that there are about 100 million bitcoin users performing almost 350K bitcoin transactions per day.
When we look at bitcoin’s adoption from the e-commerce standpoint it comes as no surprise that it has seen a sharp rise. Merchants and customers alike around the world enjoy bitcoin’s borderless and control-free transactions.
Just like bitcoin, the landscape of merchants using bitcoin has changed over the years.
We at Blockonomics recently conducted an analysis of our merchant data to explore how the market has evolved in the past years [2017–2020], leading to some interesting finds.
Here are the key takeaways from the market analysis…
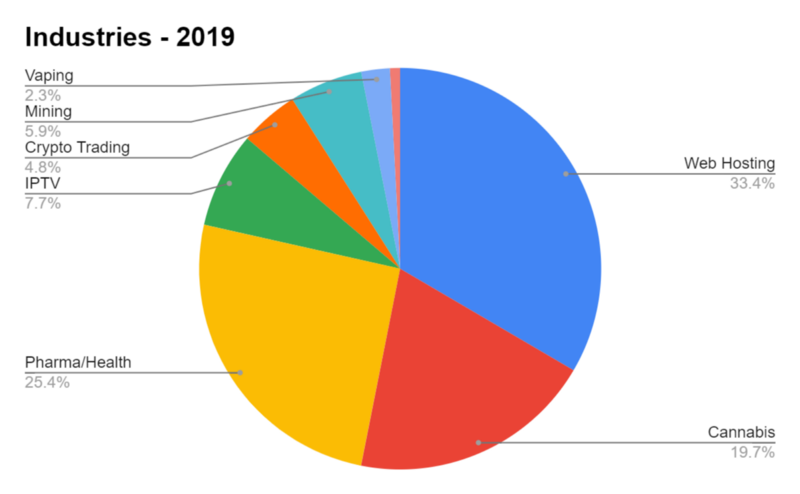
And the Winner’s are — Web Hosting, Pharma/Health, and Cannabis
These 3 industries stand out as clear winners as the top merchant industries that accept bitcoin payments.
Web Hosting, Pharma/Health, and Cannabis take almost 75% of the entire bitcoin merchant ecosystem in 2020.
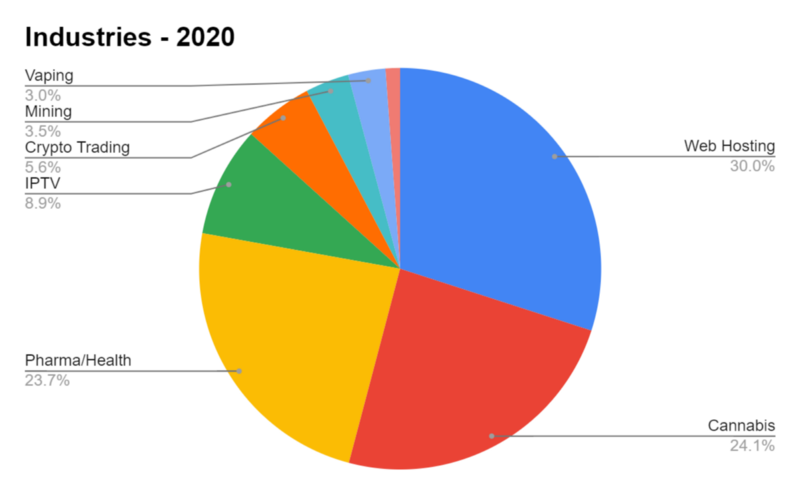
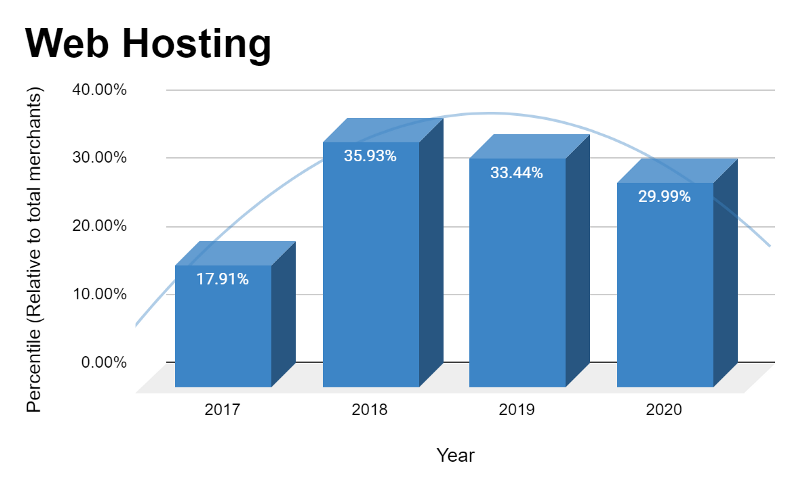
Web Hosting takes the lead as the top industry that accepts bitcoin payments. It took 30% of the total market share in 2020, which in the years 2018 and 2019 were even higher standing at 36% and 33.4% respectively.
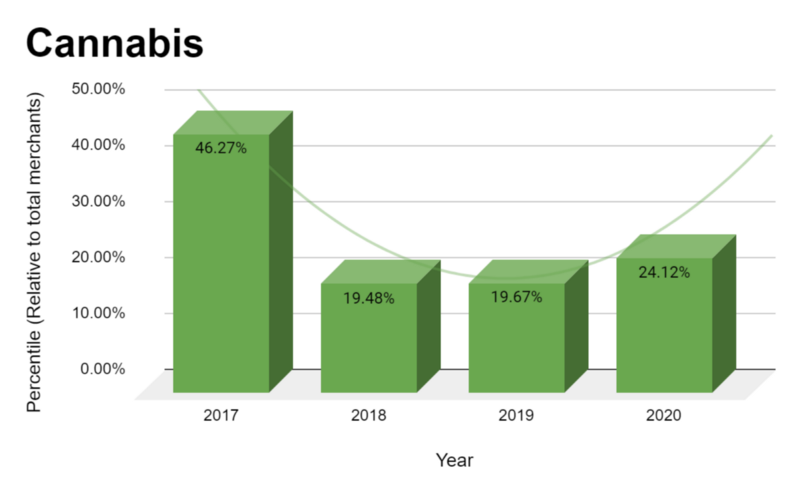
Followed by Cannabis, which captured 24.1% of the total market in 2020, a 22.6% increase from the previous year.

It really is no surprise that it is one of the fastest-growing industries that accept bitcoin as payments.
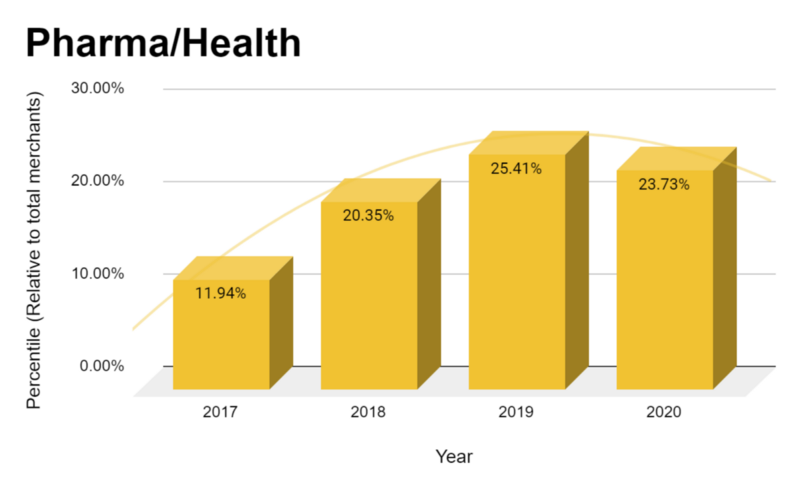
Finally, Pharma/Health takes third place in the top merchant industries for bitcoin, capturing 23.7% of the total market share, a slight drop from the previous year.
It’s ain’t just Digital, Physical Products are at a rise
Industries that have embraced bitcoin are not just selling digital products but also physical goods.
Industries such as Cannabis, Pharma/Health, Vaping have seen a rise in adoption since 2017, and the trend is only going up.
These 3 industries make for almost 50% of the entire bitcoin market pie in both 2020 and 2019.
In 2020, bitcoin adoption by the Cannabis industry grew by 54%, Vaping by 64%, and Pharma/Health by 17% compared to 2019.
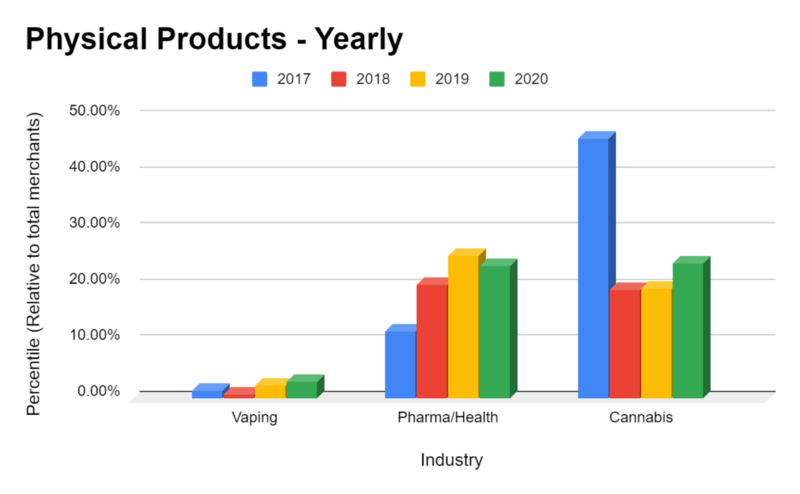
Despite the Vaping industry’s high growth rate, the biggest gains in terms of numbers were seen by Cannabis and Pharma/Health.
To Mine or Not to Mine
It is no surprise that bitcoin gave birth to a whole new industry, numerous businesses pertaining to the blockchain space emerged up after bitcoin’s inception.
One such industry is Cryptocurrency Mining, a pivotal industry when it comes to bitcoin and blockchain. For those of you who don't know, it is through miners that transactions in blockchain get confirmed and new bitcoin is created/mined.

drop
The above takeaway might come as a bit of a surprise to some of you as bitcoin’s mining hash rate has only increased with time, currently standing at 136.5 TH/s, which means that greater computational power is spent and the transactions are more secure and resistant to attacks.
notbitcoin miningmining hardware mining power
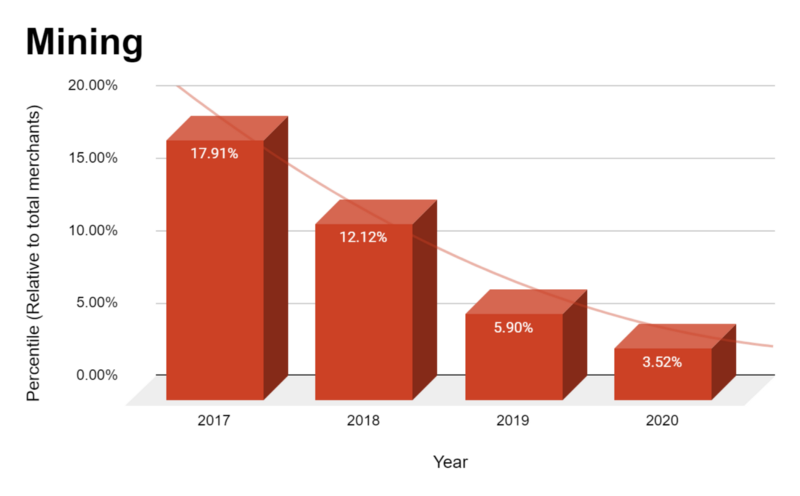
Despite the increase in mining hash rate each year, this dip in adoption does not come as a total surprise as mining is a highly competitive space.
The mining space has seen some rocky times, especially after the 2018 cryptocurrency price crash.
After an all-time high in December 2017, bitcoin’s price fell by almost 65%, severely affecting the mining business as sales almost disappeared. As a result, Nvidia, a leading GPU manufacturer (used by miners), lost $23 Billion in market value.
Also, mining in recent times has been turning to be less profitable especially for small businesses, due to increasing operation costs, bitcoin halving, and an increase in mining difficulty, leaving the space for bigger players with direct access to manufacturing equipment.
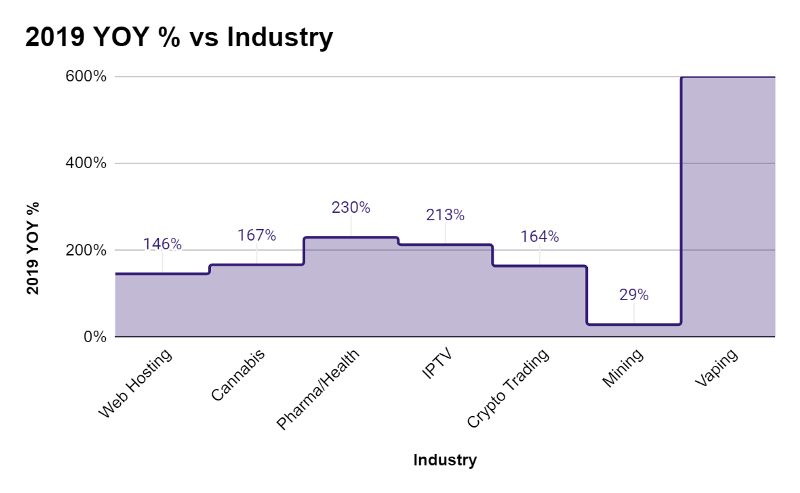
Smokes Screens and Pipe Dreams
The 3 industries that saw the highest growth rate in the year 2020 compared to 2019 were Cannabis, Vaping, and VPN.
VPN saw the highest increase of 80%, followed by Vaping with 64% and finally by Cannabis with 54%.
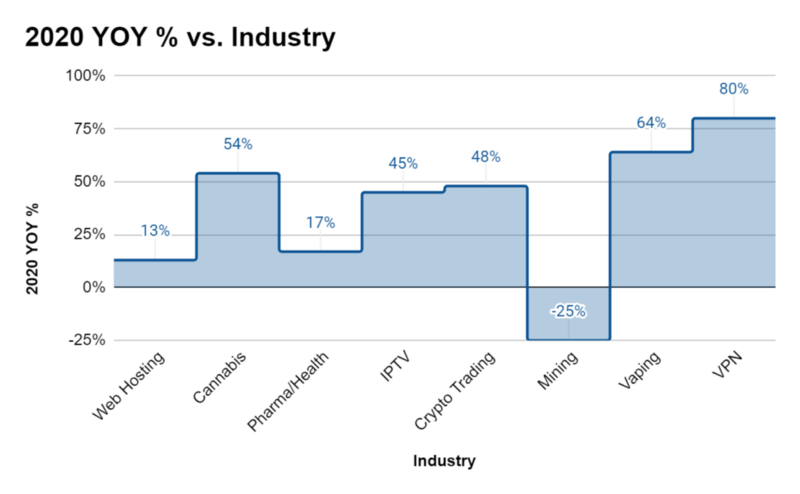
In 2019, the top industries to see growth were slightly different, with Vaping taking the lead followed by Pharma/Health and IPTV.
Vaping saw an impressive growth rate of 600% while Pharma/Health saw an increase of 230% and IPTV of 213%.
Conclusion
The bitcoin merchant market has evolved quite a lot in the past 4 years and like any other market is not free from economic factors.
International regulations, media/news, number of bitcoin transactions, price, all affect its adoption. This essentially is a good thing as it makes bitcoin part of the global economy and not separate from it.
While some industries like Web Hosting, Cannabis, and Pharma/Health (accounting for 75% of the total bitcoin merchant count) see a major rise in the number of merchants, industries like Cryptocurrency Mining see a decline in adoption in 2020.
Industries like Vaping, Cannabis, and VPN see the highest growth rate in 2020, while in 2019 this trend included Pharma/Health, IPTV, and Vaping.
Interestingly, bitcoin fared pretty well when it comes to merchants selling physical products. Cannabis, Pharma/Health, and Vaping accounted for 50% of the total merchant's count in 2020–19.
Bitcoin despite being only a decade old has made waves in the global market and what’s next to come can be nothing short of exciting.
Just like bitcoin its merchant market still has a long way to go and the outlook looks optimistic.
Disclaimer:
- The market research is conducted by the data belonging to Blockonomics and includes a total of 6000 of its merchants spanning over the period 2020 to 2017. The analysis is based on 30% of the total merchant data collected.
- No geographic data has been collected or analyzed due to privacy.
- The data for the year 2020 reflects merchants until the month of August 2020.

![Top 10 Tools and Resources for Crypto Research [2021]](/content/images/size/w720/max/800/1-kDyyUnRCD656bm2ny-jHag.png)

Comments ()